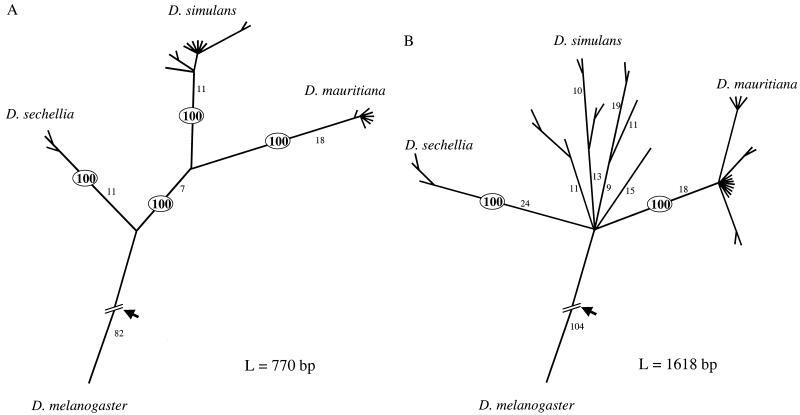
Figure 3.
Genealogies of region A or B (as shown in Fig. 2) among the four sibling species of Drosophila, as inferred by the maximum parsimony method (paup, version 3.1.1). Variation at other loci published so far exhibits genealogies similar to that of B (see text). Branch length is proportional to the inferred number of changes, which are given along the major branches. The short terminal branches often represent 0 changes. Adjacent nodes whose bootstrapping value is lower than 50% are compressed into a single node. The bootstrapping values of the four interspecific nodes are of special interest. In A, they are all 100%, as shown, but in B, two are less than 50% and are compressed into a star phylogeny. Arrow indicates the root. L, Number of nucleotides analyzed.

