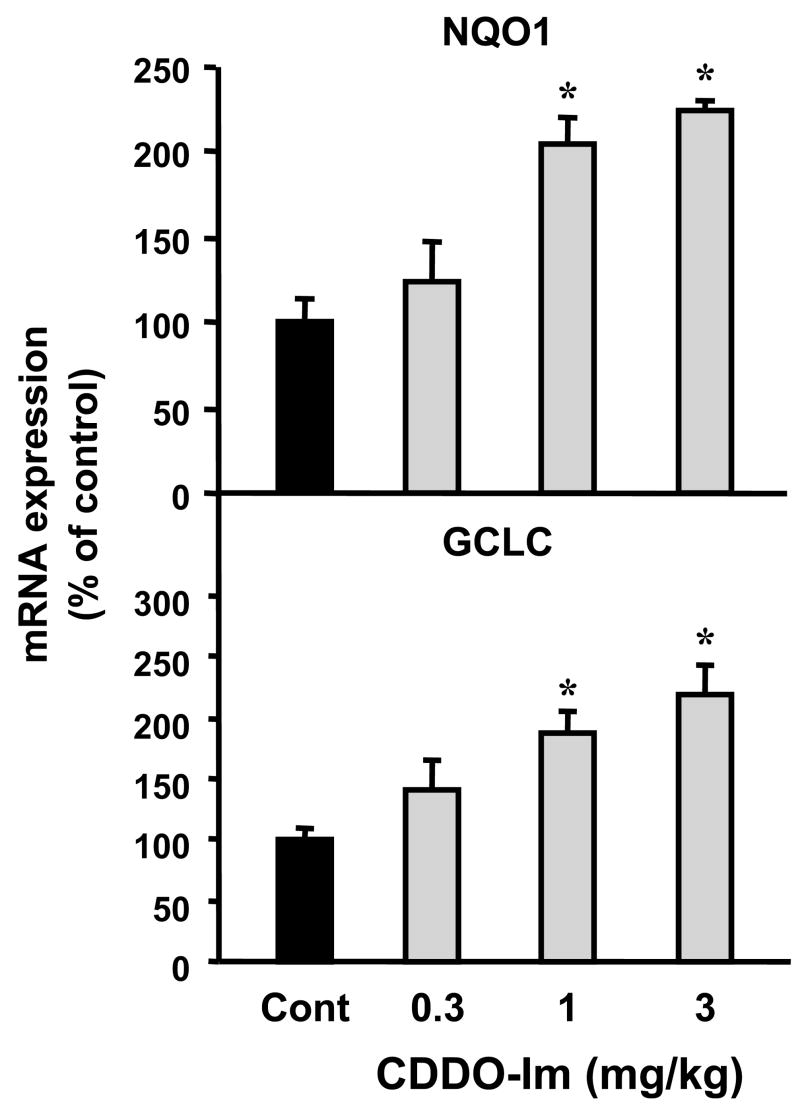
Fig. 10. Dose response of Nrf2 target gene expression after CDDO-Im administration.
Total RNA was isolated from CDDO-Im-treated mouse kidneys at different dose levels (0, 0.3, 1, and 3 mg/kg) and analyzed by the bDNA assay as described in MATERIALS AND METHODS. Data are presented as mean (percent of control) ± S.E.M. (each group, n = 3–5 animals). Asterisks (*) represent statistically significant differences (p < 0.05) between control and CDDO-Im groups.

