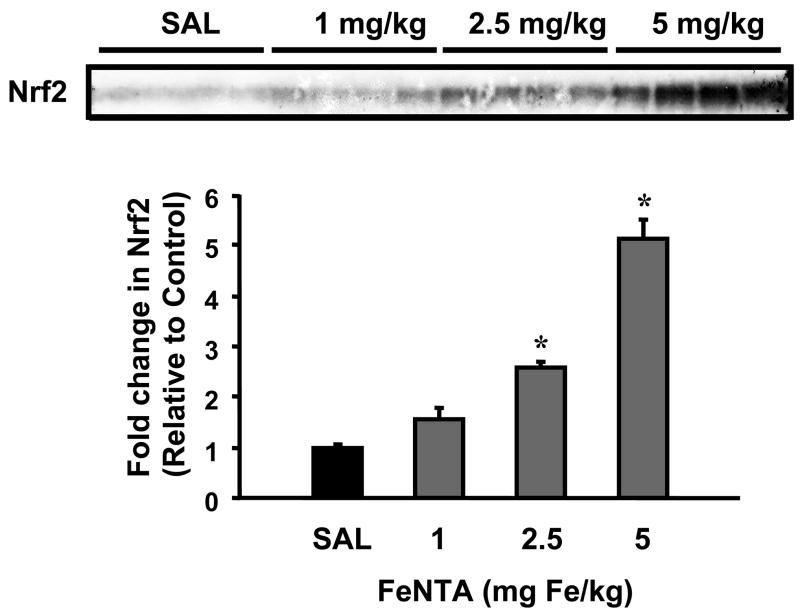
Fig. 2. Dose response of nuclear Nrf2 protein expression in kidneys 6 h after FeNTA treatment.
Nuclear extracts was made from kidneys of control (saline, SAL) and FeNTA-treated mice at different doses (1, 2.5, and 5 mg Fe/kg body) at 6h. A western blot of nuclear extracts stained with an antibody that detects mouse Nrf2 (50 μg protein/lane) is shown. Immunoreactive bands were semiquantitated by densitometric analysis. Data were normalized to SAL control and expressed as mean ± S.E.M. (each group, n = 4 animals). Asterisks (*) represent statistically significant differences (p < 0.05) compared to vehicle-treated mice.

