
FIG. 3.
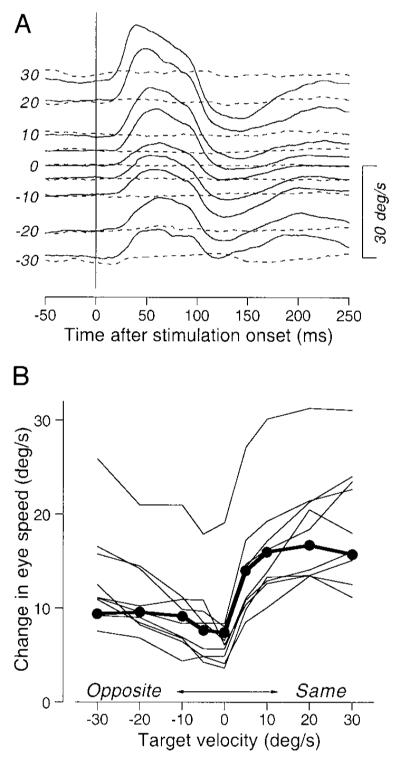
Effects of target velocity on the magnitude of electrically-elicited smooth eye movements. A: examples of the time courses of average horizontal eye velocity for stimulation with a 75-ms train of pulses at 333 Hz, 50 μA during tracking of different target velocities. Solid and dashed lines, data obtained with and without stimulation. Numbers at the beginning of traces indicate target velocity. The positive numbers indicate rightward target motion. Upward deflections of average traces indicate rightward eye movements. B: amplitudes of the responses to stimulation as a function of target velocity. The positive and negative values of target velocity indicate target motion in the direction of electrically elicited smooth eye movements (Same) or the opposite direction (Opposite). Each connected line indicates data from single stimulation site. The filled symbols connected by thick lines plot measurements made from the data in A.