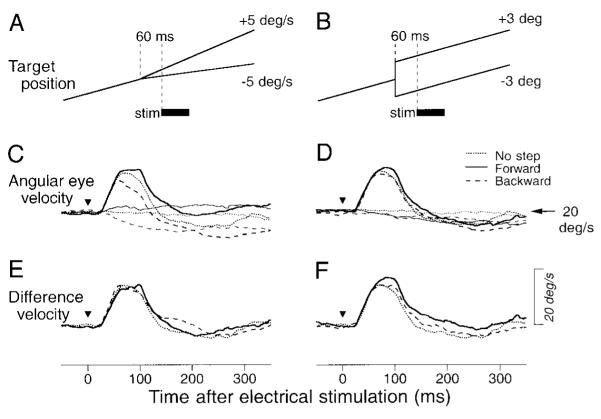
FIG. 4.
Absence of the effect of retinal events at the time of electrical stimulation on the magnitude of response. A, C, and E: responses to retinal velocity errors. B, D, and F: responses to retinal position errors. A and B: schematic drawings of experiments. A target moving at 20°/s changed velocity by 5°/s (A) or position by 3° (B) when it crossed the center of the screen. The thick bar labeled “stim” indicates the time of microstimulation. C and D: averages of angular eye velocity for stimulation (thick lines) or control (thin lines) trials. Traces are aligned on the onset of stimulation or equivalent time in the nonstimulation controls (triangles). Different line types indicate different directions of image velocity (C) or position (D) relative to ongoing target motion: dotted traces, control trials; solid traces, retinal stimulus in direction of target motion; long dashed traces: retinal stimulus in direction opposite to target motion. E and F: difference eye velocity, documenting the time courses of the difference in eye speed between the stimulation trial and nonstimulation control.

