FIG. 7.

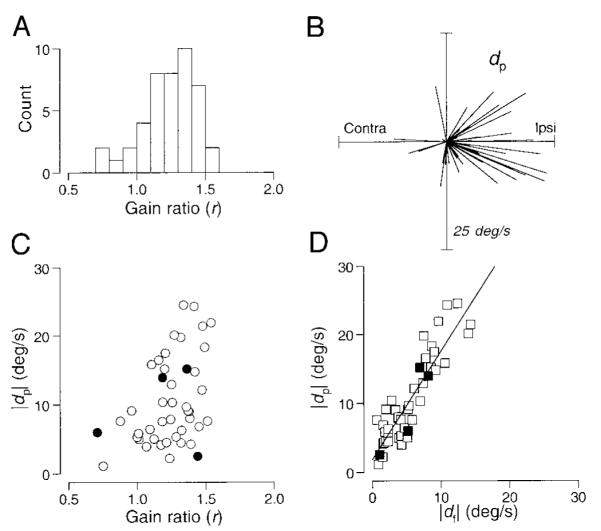
Quantitative analysis of the interaction between ongoing pursuit and the eye movements evoked by electrical stimulation for 44 sites. Data were fitted by the equation, S = r*C + dp, where r represents the ratio of pursuit gain and dp represents the directional component injected during pursuit. A: distribution of the gain term (r). B: polar plot where each line is a vector showing the direction and amplitude of the eye velocity caused by stimulation during pursuit (dp). C: relationship between the size of the eye movement evoked by stimulation during pursuit (dp) and the gain enhancement of ongoing pursuit (r). The correlation coefficient was 0.41. D: amplitude of the eye velocity caused by stimulation during the maintenance of pursuit (dp) compared with that during fixation (df). The regression line has a slope of 1.58, a y intercept of 1.84, and the correlation coefficient was 0.90. In C and D, each point shows data from a single stimulation site; filled symbols indicate measurements from the data shown in Fig. 5.
