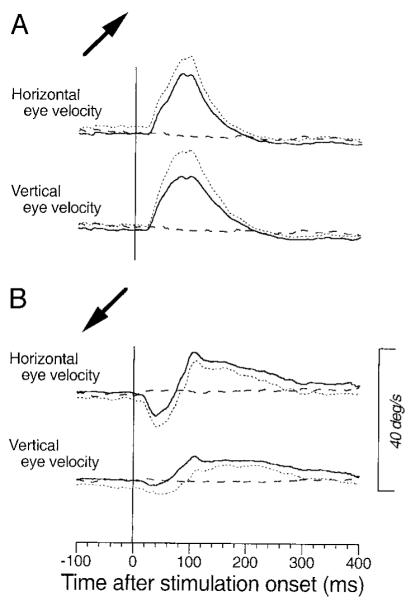
FIG. 8.

Evidence for the presence of 2 components with different time courses resulting from FPA stimulation. Averages of eye velocity (—) are aligned on the onset of stimulation applied during the maintenance of pursuit. . . . , the mean plus 1 SD. - - -, average eye velocity in the nonstimulation control trials. Stimulation of this site during fixation elicited smooth eye movements in right-up direction. The → at the left of each panel indicate the direction of pursuit during stimulation. A: right and up. B: left and down. → in A also indicates the direction of the eye movement evoked by stimulation at this site during fixation. Stimulation was applied for 75 ms starting 600 ms after target motion onset. Target speed was 20°/s.
