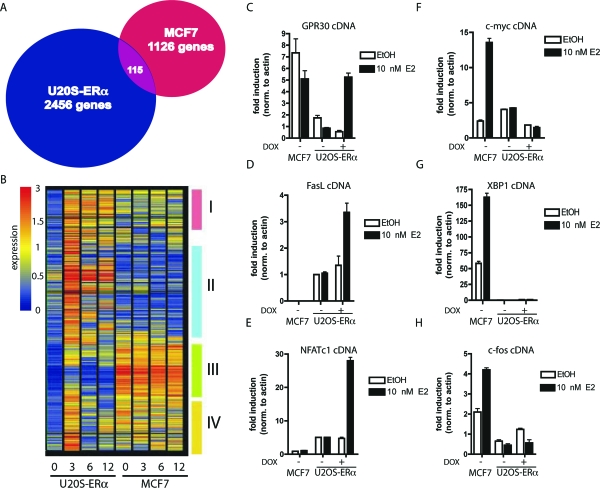
Figure 1.
ERα-Mediated Gene Expression in Different Cell Types
A, Venn diagram showing the number of genes regulated by 10 nm E2 for 3 h in MCF7 and U2OS-ERα cells. B, Cluster analysis of all of the genes up-regulated in U2OS-ERα cells at 3 h. Each column represents a time point (0, 3, 6, or 12 h) in U2OS-ERα or MCF7 cells and contains all of the genes up-regulated in U2OS-ERα cells at 3 h. Groups I–IV are described in the text. C–H, U2OS-ERα and MCF7 cells were deprived of E2 for 3 d in phenol red-free medium containing 5% CDT-FBS. U2OS-ERα cells were either treated with (to induce ERα) or without DOX for 24 h. They were then treated with 10 nm E2 for 3 h, and RNA was obtained. GPR30, FasL, NFATc1, c-myc, XBP1, and c-fos cDNA were analyzed by quantitative PCR. Error bars for all parts represent mean ± 1 sd.

