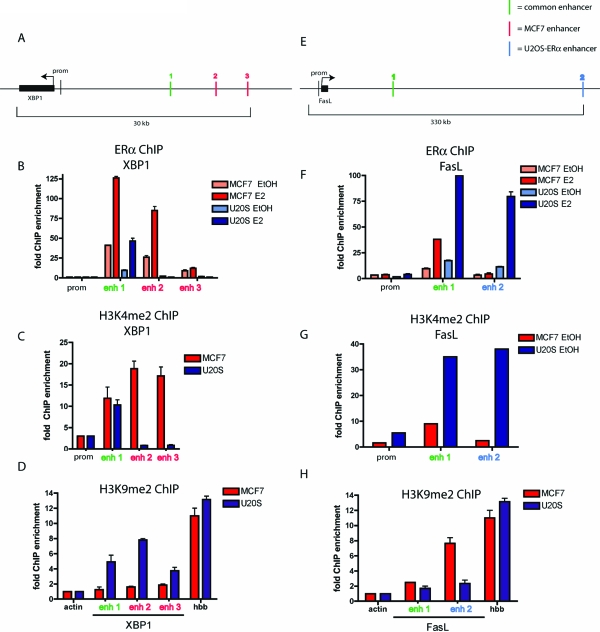
Figure 8.
Histones in U2OS-ERα and MCF7 Cells Are Differentially Methylated
A, Diagram of the XBP1 locus with the three enhancers shown as vertical lines. B, U2OS-ERα and MCF7 cells were treated with 10 nm E2 for 45 min, and ChIP was performed with an antibody to ERα. Quantitative PCR was performed with primers to the XBP1 enhancers and promoter. C, ChIP was performed as in B but with an antibody to H3K4me2. D, ChIP was performed as in B but with an antibody to H3K9me2. Quantitative PCR was performed with primers to the XBP1 enhancers, actin promoter, and hemoglobin (HBB) promoter. E, Diagram of the FasL locus with the two enhancers. F, ChIP was performed as in B. Quantitative PCR was performed with primers to the FasL enhancers and promoter. G, ChIP was performed as in B but with an antibody to H3K4me2. Quantitative PCR was performed with primers to the FasL enhancers and promoter. H, ChIP was performed as in B but with an antibody to H3K9me2. Quantitative PCR was performed with primers to the FasL enhancers, actin promoter, and hemoglobin (HBB) promoter. Error bars for all parts represent mean ± 1 sd.

