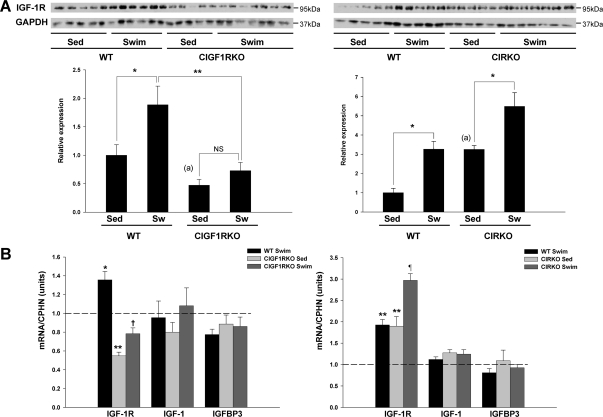
Figure 4.
IGF-IR Expression
A, IGF-IR expression in the hearts of sedentary (Sed) and swim-trained (Sw) WT, CIGF1RKO, and CIRKO mice. Upper panels are representative blots, and lower panel is densitometry of results from five to seven hearts per group. *, P < 0.05; **, P < 0.01; NS, not significant. a, P < 0.05 vs. WT Sed (by Student’s t test). B, mRNA levels expressed as fold change compared with sedentary WT. n = 7–8 per group. *, P < 0.05; **, P < 0.01 vs. WT Sed; †, P < 0.001 vs. WT swim; ¶, P < 0.001 vs. CIRKO Sed.

