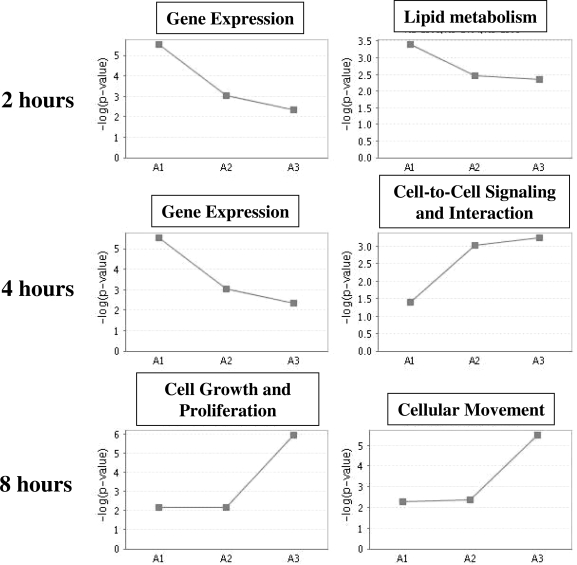
Figure 4.
The Function of Estrogen-Regulated Vascular Genes over Time
For each set of estrogen-regulated vascular genes (2, 4, and 8 h), the two highest overrepresented molecular and cellular functions by Ingenuity Pathway Analysis are depicted. The y-axis indicates the −log (P value) of the overrepresentation of the depicted function at each time point compared with a random gene set. The x-axis includes the three time points (A1 = 2 h; A2 = 4 h; A8 = 8 h).

