. 2008 Nov-Dec;43(6):640–658. doi: 10.4085/1062-6050-43.6.640

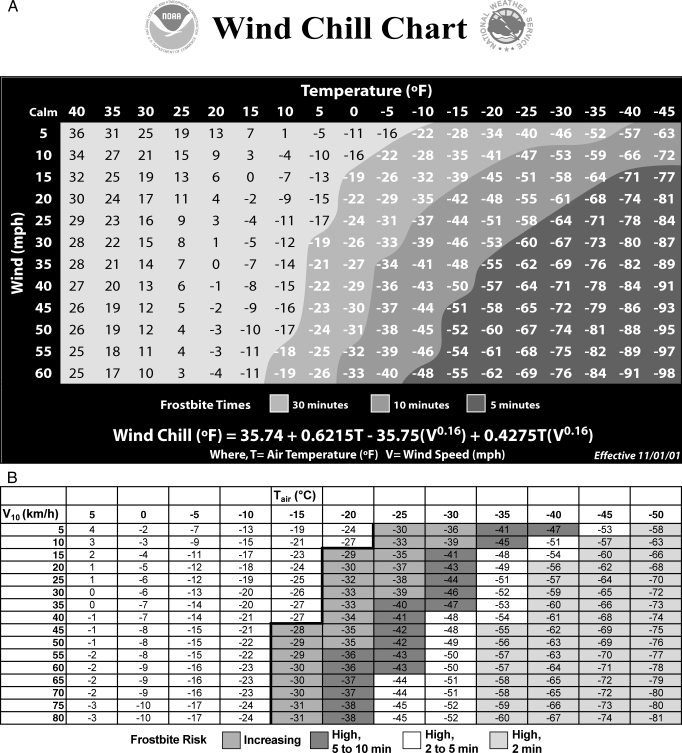
Figure 4. A, United States National Weather Service Wind Chill Chart (figure reproduced from http://www.weather.gov/os/windchill/images/windchillchart3.pdf). B, Meteorological Society of Canada/EnvironmentCanada Wind-Chill Calculation Chart (figure adapted from http://www.msc.ec.gc.ca/education/windchill/windchill_chart_e.cfm). Tair  =  Actual air temperature in °C; V10  =  wind speed at 10 m in km/h (as reported in weather observations). Temperatures to the left of the bold line are a low risk of frostbite for most people. Increasing indicates within 30 min, increasing risk of frostbite for most people within 30 minutes of exposure; High, 5 to 10 min, high risk for most people in 5 to 10 minutes of exposure; High, 2 to 5 min, high risk for most people in 2 to 5 minutes of exposure; and High, ≤2 min, high risk for most people in ≤2 minutes of exposure. Conversions: °F  =  (°C × 9/5) + 32; mile  =  km × 0.6214.

Figure 4