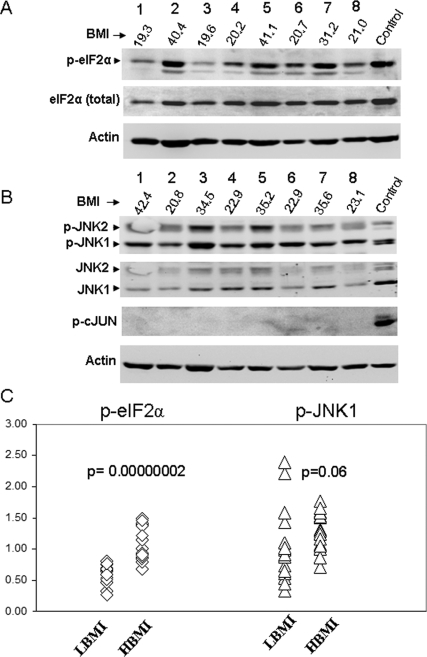
Figure 3.
Western blot of phosphoproteins. Representative Western blots showing samples with high and low BMI. Antibodies are either total protein as noted, or phosphoproteins. A, Total and phosphorylated eIF2α, with β-actin for normalization. Control is palmitate-treated HepG2 cells, which show acute ERSR. Numbers below lane numbers 1–8 give BMI of individuals represented. B, Phosphorylated and unphosphorylated forms of JNK1 and JNK2, and phosphorylated c-jun. Control is from palmitate-treated HepG2 cells. The gel is representative of Western blots on 34 individuals, as described in the Results, with each individual measured at least twice. C, Scatterplot for 34 samples for p-eIF2α and p-JNK1. Significance (P values) is based on the Mann-Whitney U test. HBMI, high BMI group (n = 19); LBMI, low BMI group (n = 15).

