
Figure 3. High fat (HF) diet ameliorated signaling differences observed in the NAc of ΔFosB overexpressing mice.
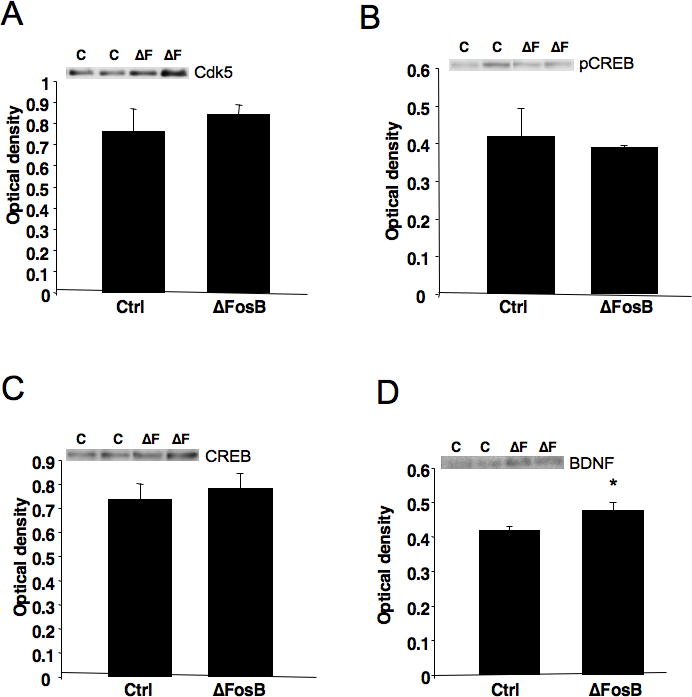
Following 6 wks of HF diet, levels of (A) Cdk5, (B) pCREB, and (C) CREB were not different between control (Ctrl) and ΔFosB mice. (D) ΔFosB mice displayed elevated BDNF levels relative to controls at the end of 6 wks of HF (P = 0.05). Representative bands from control (C) and ΔFosB (ΔF) mice are shown for all figures. *Significantly different from control.