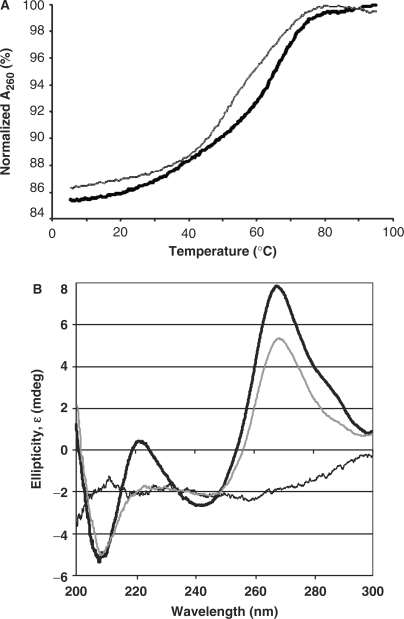
Figure 5.
Thermal denaturations and circular dichroism spectra of the  -Ψ27 and the
  -Ψ27;f5C34. (A) Thermodynamic stability of the ASLs. UV-monitored, thermal data were averaged from three denaturations and two renaturations for the
  -Ψ27;f5C34 (thin gray line) and for the
  -Ψ27 (thick black line). (B) Circular dichroism spectra. Spectra of the
  -Ψ27;f5C34 (thin gray line) and that of the
  -Ψ27 (thick black line) at the approximately equal concentrations of 2 µM were collected over the wavelength range of 200 to 300 nm.

