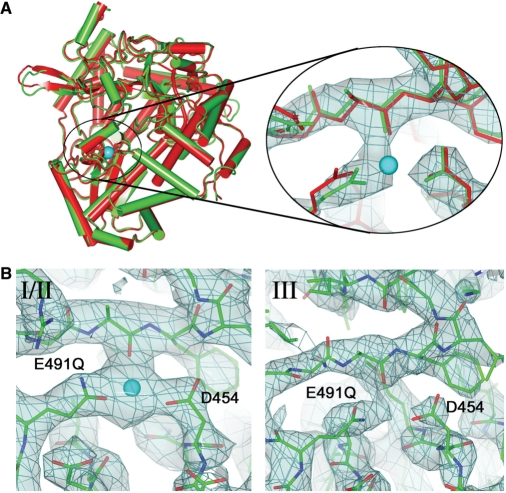
Figure 1.
Mn2+ ion binding to ϕ6 wt and E491Q polymerases. (A) Cartoon representation of the overall superposition of the apo E491Q mutant model (green) with the wt model (red). The Mn2+ ion bound to the wt is shown as a cyan sphere. The zoom view shows the manganese-binding site for the same molecule, with the electron density shown in light blue. The wt enzyme is shown in red showing the difference in the side chain position for E491Q. The manganese ion from the wt model is again shown in cyan. (B) The manganese-binding site in the E491Q-RNA-Mn2+ complex, showing electron density for molecule I in the left panel (molecule II is essentially indistinguishable) and for molecule III. The Mn2+ ion, present only in molecules I and II is shown in cyan.

