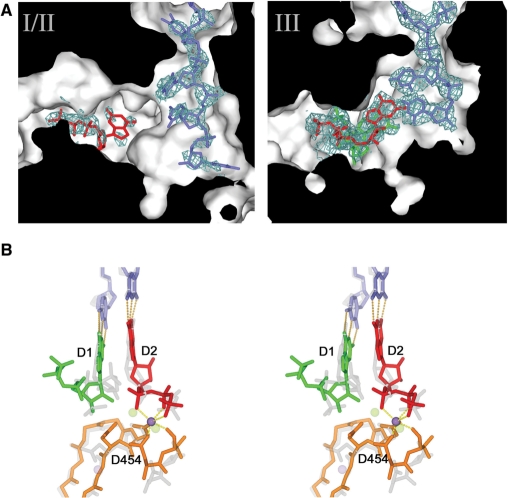
Figure 5.
NTP and template binding to E491Q polymerase. (A) Cut through of molecules I and III in the E491Q-DNA-GTP-Mg2+-Mn2+ complex to show the substrate and template tunnel, revealing weak density for DNA and GTP in molecules I/II and strong density for an inhibited complex of the DNA oligo (in blue) and 2 GTPs (D1 in green and D2 in red) in molecule III. (B) Stereo view of the inhibited complex compared to the initiation complex described in reference 14. The DNA oligonucleotide and the two GTPs of the inhibited complex are coloured as molecule III (right hand panel), and the manganese ion is coloured in purple. The protein components are in orange. The corresponding components of the active initiation complex (14) are drawn in semi-transparent grey, and the structural manganese ion and the catalytic magnesiums are drawn in semi-transparent purple and green, respectively. The two GTPs are labelled D1 and D2.

