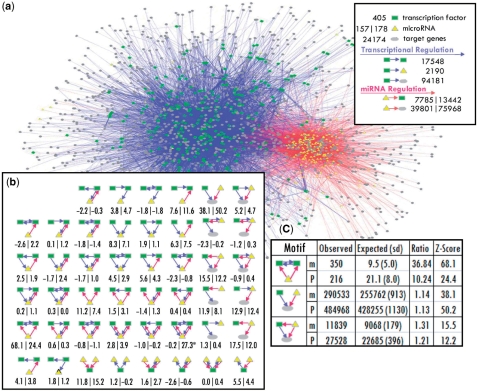
Figure 1.
Network motifs involving both TFs and miRNAs. (a) Integrated regulatory network (IRN). (b) The 46 possible three-node subgraphs involving at least one TF and one miRNA. The numbers under the subgraphs are the Z-scores of their occurrences as compared with random networks. The number pairs formatted as x|y represent the statistics from miRanda|PicTar-derived IRNs. The correlation coefficient between the Z-scores from two data sets is 0.73 (P < 10−9). The only subgraph whose Z-scores are not consistent between two data sets is marked with star, which occurs only a few times in the IRNs. (c) Top network motifs. Rows with m are for miRanda and p for PicTar.

