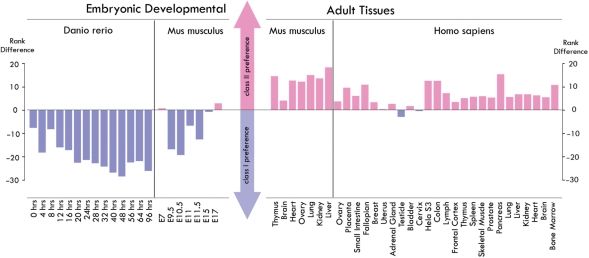
Figure 4.
miRNA expression levels at embryonic developmental conditions and adult tissues. For each condition, we ranked the miRNAs based on their expression level and then compared the average ranks between two classes. We compared the observed rank difference with that expected from two random groups. P-values were calculated to evaluate the significance for the rank difference. The miRNA expression data sets are obtained from (38) for zebra fish (39,40) for mouse and (41) for human.

