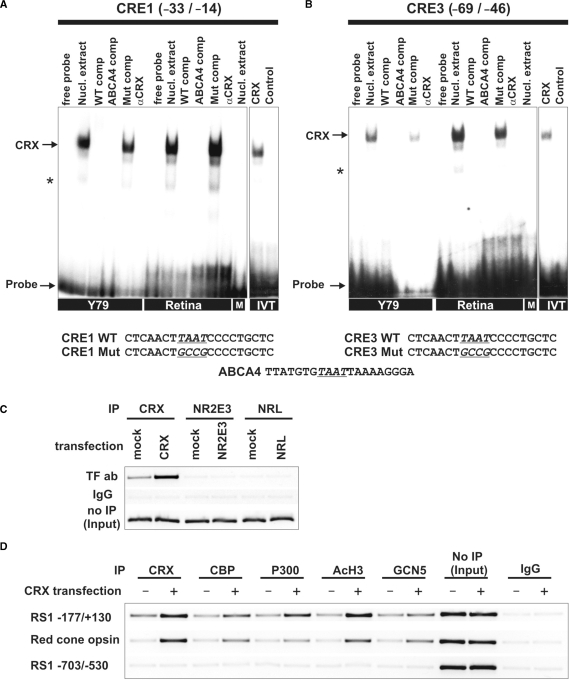
Figure 3.
CRX, HATs and AcH3 are associated with the RS1 promoter region. (A and B) EMSAs with Y79, mouse retina, BV-2 microglia nuclear extracts or in vitro translated transcription factors. The sequences used for EMSA analysis are shown below with the mutated nucleotides underlined and conserved motifs printed in bold letters. Each gel was loaded with 5 µg of nuclear extracts or 4 µl of in vitro translated proteins, as indicated. Arrows represent specific binding identifiable by shifted bands that were inhibited by excess unlabeled weight or consensus oligonucleotides, but not by their mutant counterparts. Incubation with BV-2 microglia cells nuclear extract (M) did not result in a specific band shift. Addition of 1 µl anti-CRX antibody did not produce a supershift, but specifically inhibited CRX binding to the oligonucleotide. Asterisks indicate unspecific bands. (A) Interaction of RS1 CRE1 and (B) CRE3 with proteins in Y79 cells, mouse retina, BV-2 cells (M) and in vitro translated CRX (IVT). (C) ChIP assays using wild-type Y79 cells or Y79 cells transfected with CRX, NR2E3 or NRL. Immunoprecipitation was carried out with antibodies against CRX, NR2E3 or NRL. Input DNA served as positive control and IP with rabbit IgG antibody served as negative control. The RS1 promoter fragment −177/+130 was analyzed for in vivo CRX, NR2E3 and NRL binding by ChIP–PCR. (D) ChIP assays using wild-type or CRX-transfected Y79 cells with antibodies against CRX, CBP, P300, AcH3 and GCN5. Input DNA served as positive control and IP with rabbit IgG antibody served as negative control. DNA fragments were analyzed by PCR for two different RS1 promoter fragments and the red-cone opsin promoter. The RS1 promoter fragment −177/+130 and the red-cone opsin control promoter displayed ChIP-PCR positive signals whereas the RS1 promoter region −703/−530 lacking CRX sites did not show specific CRX binding.

