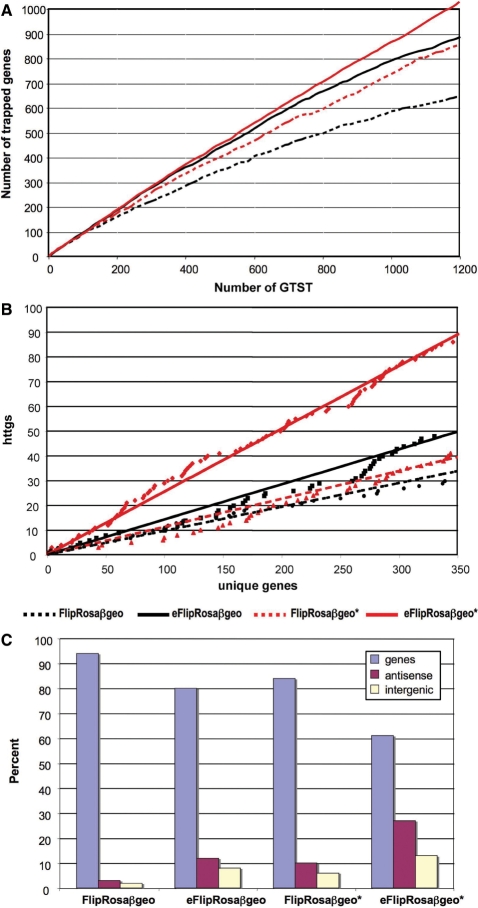
Figure 6.
Gene trapping efficiencies with enhanced vectors. (A) Overall trapping efficiency. The number of novel genes trapped was plotted against the number of accumulating gene trap sequence tags (GTSTs). (B) Trapping rate of hard to trap genes (httgs). ‘Hard-to-trap genes’ are defined as genes that have no entry or only one entry in the IGTC, Omnibank I or Omnibank II gene trap libraries. The number of hard-to-trap ENSEMBL genes trapped was plotted against the cummulative number of unique genes trapped. Note that only ENSEMBL protein-coding genes were considered for this analysis. (C) Trapping rate of antisense transcripts and intergenic regions. Results are based on SPLK tags obtained from a minimum of 1500 ECS lines trapped with each vector.

