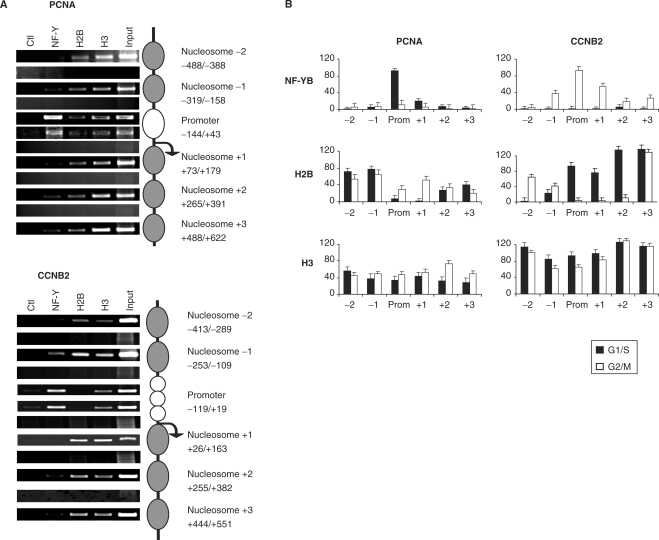
Figure 2.
Single nucleosome mapping on Cyclin B2 and PCNA promoters. (A) Semiquantitative PCR analysis of ChIPs with G2/M and G1/S cells; representative amplicons indicate nucleosomes positioning, according to the strategy detailed in Supplementary Figure 1. The antibodies used are indicated. (B) Distribution of core histone proteins and NF-Y on the Cyclin B2 and PCNA promoters, from –500 bp to +500 bp. The black bars correspond to chromatin from G1/S cells, the white ones from G2/M cells. ChIPs were performed with the indicated antibodies and analysis was done by Q-PCR with primers at the boundaries of each nucleosome, as in (A) and described in Supplementary Figure 1.

