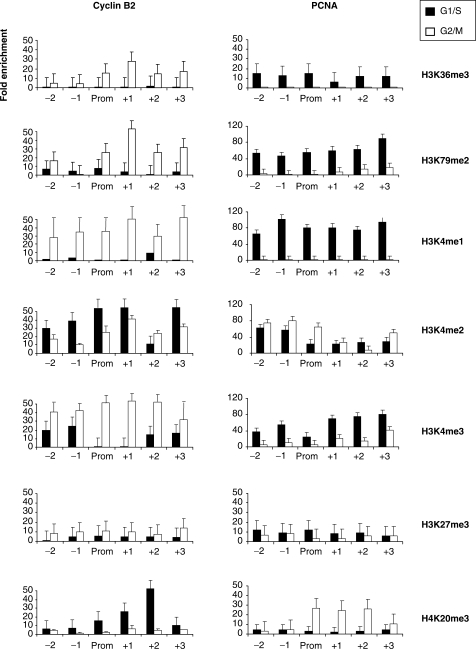
Figure 3.
Histone methylations on Cyclin B2 and PCNA promoters. Analysis of the distribution of H3/H4 methylations along Cyclin B2 and PCNA genes. Black bars represent the data from G1/S cells, the white ones from G2/M cells. ChIPs were performed with the indicated antibodies and analyzed by Q-PCR with the appropriate amplicons. Values are reported as fold enrichment calculated with the following formula: 2ΔCtx−2ΔCtb, where ΔCtx = Ct input−Ct sample and ΔCtb = Ct input−Ct control Ab (Flag). All values are normalized for the amount of H3 and H4 immunoprecipitated. Error bars represent SD, calculated from three independent experiments.

