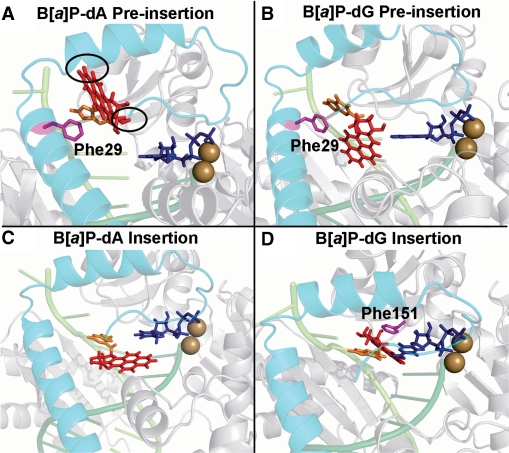
Figure 4.
Pol κ/DNA complex models with lowest energy based on the VDW energy surveys. The complexes are shown in cartoon mode. The N-clasp is cyan; the DNA strands are light and dark green; the B[a]P lesion is red stick; the damaged adenine or guanine are in orange; the side chains of Phe29 and Phe151 are in magenta stick. (A) The dA adduct is in the preinsertion position. Note that the B[a]P rings are directed toward the N-clasp. The two black ovals indicate the crowding between the adduct and the N-clasp. (B) The dG adduct is in the preinsertion position. The adduct is not near to the N-clasp. Phe29 stacks with the damaged guanine on the DNA major groove side. (C) The dA adduct is in the insertion position opposite dTTP, but with syn glycosidic bond conformation that is not capable of Watson–Crick pairing. (D) The dG adduct is in the insertion position. The adduct is on the DNA minor groove side Watson–Crick paired with dCTP and B[a]P is stacked with Phe151. Stereoviews are shown in Supplementary Figure S8.

