
FIGURE 3.
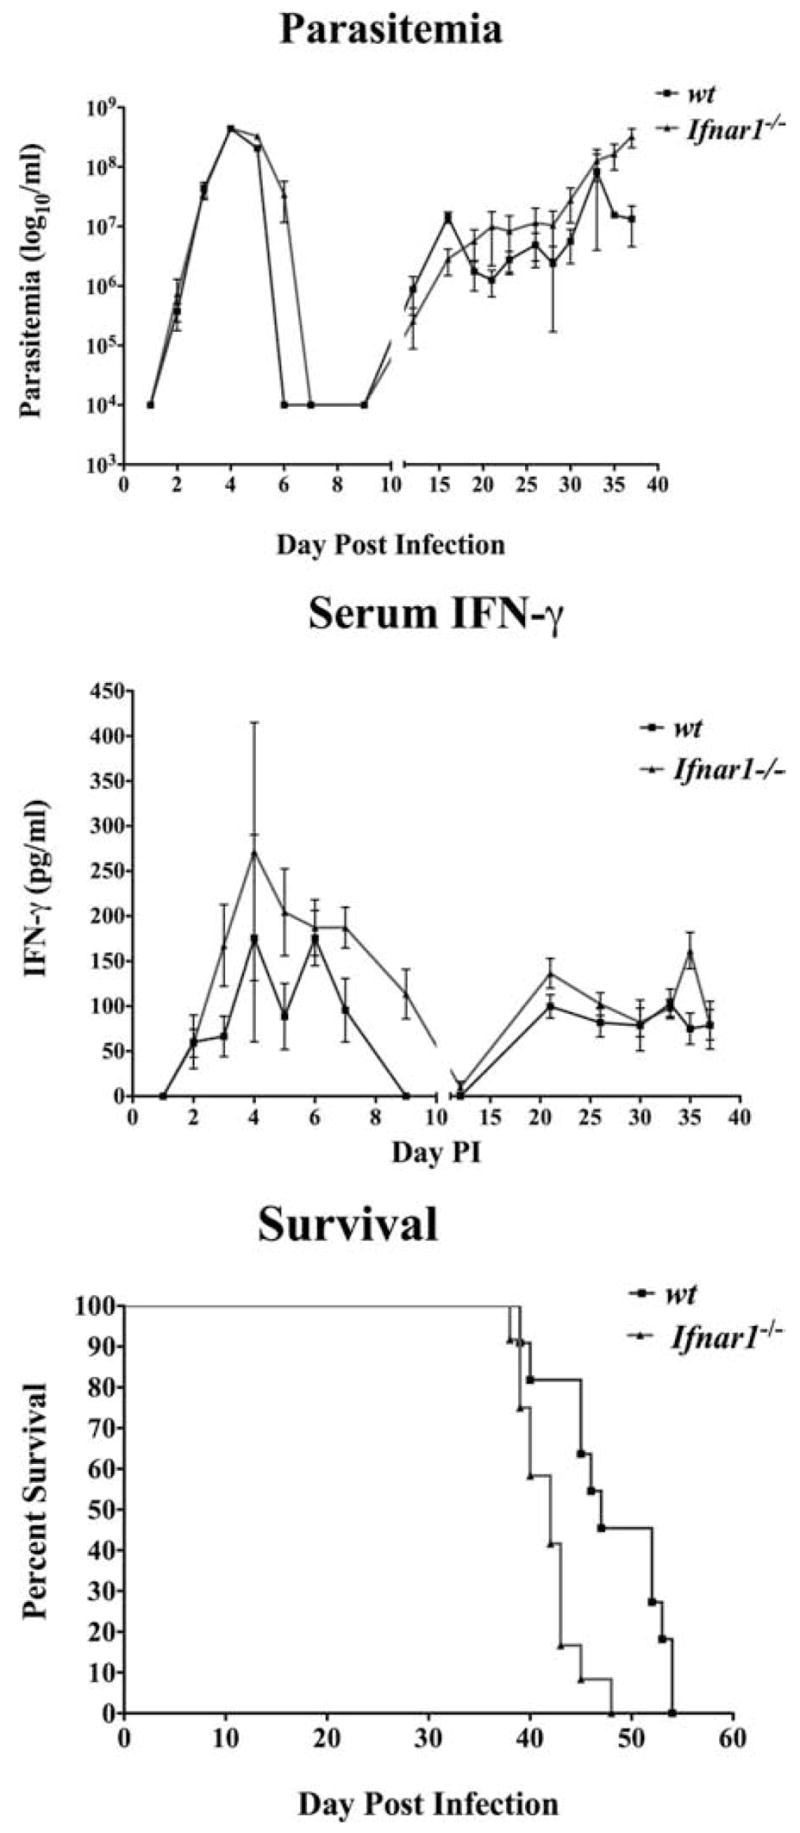
Comparative parasitemias, serum IFN-γ levels, and survival times of trypanosome-infected wt and Ifnar−/− mice. Coordinate measurements are shown of parasitemia (top) and serum IFN-γ (middle) and survival times (bottom) of infected Ifnar1−/− (■) and wild-type C57BL/6 mice (▲) (determinations are from four independent experiments). Mice were injected i.p. with 105 trypanosomes and monitored daily by tail bleed. Parasitemia was assessed at the times shown via enumeration of live parasites. Concentrations of IFN-γ in the serum were determined by sandwich ELISA.