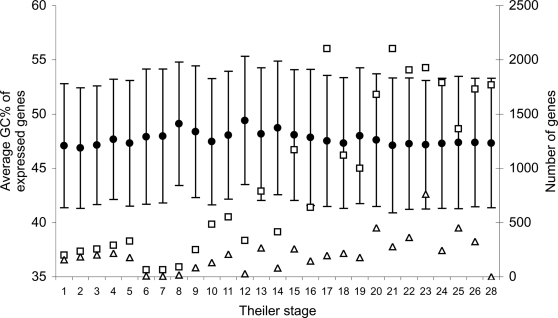
Figure 9. Gene features during development.
The average GC-content for mouse genes expressed during embryo development shown as filled circles (left axis). Error bars correspond to plus/minus one standard deviation. Theiler stages as in Figure 7. The number of mouse genes in our data set being expressed for each stage is shown on the right y-axis. Squares: All detection methods; Triangles: RT-PCR detection only.

