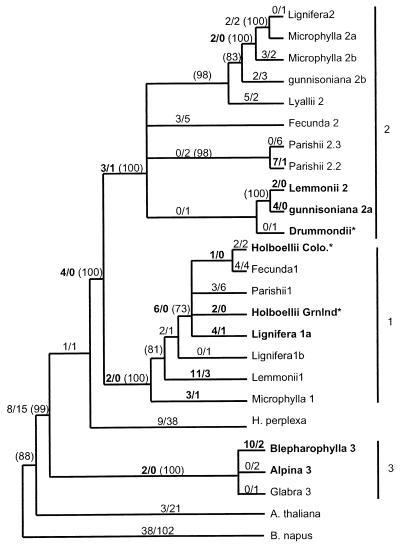
Figure 2.
Combined phylogeny of several parsimony phylogenies rooted with B. napus. See Materials and Methods for details of construction. Numbers along each branch show the number of nonsynonymous substitutions/number of synonymous substitutions for that branch, estimated by maximum likelihood for an unrooted tree, and numbers in parentheses show the percent support among 1,000 bootstrap data sets, calculated for each of the component parsimony trees. Branches showing only bootstrap support have estimated branch length = 0, but bootstrap support > 70%, whereas those with no bootstrap values have support < 70%. Numbers shown in bold highlight Ka > Ks (but do not denote significance), and gene names in bold indicate genes involved in significant pairwise comparisons. * denotes phylogenetic position based on coding sequence only. Substitution counts differ from direct pairwise comparisons because the former are estimated by likelihood methods and the latter by approximate methods. Branch lengths are drawn so as to make clades easily discernable.

