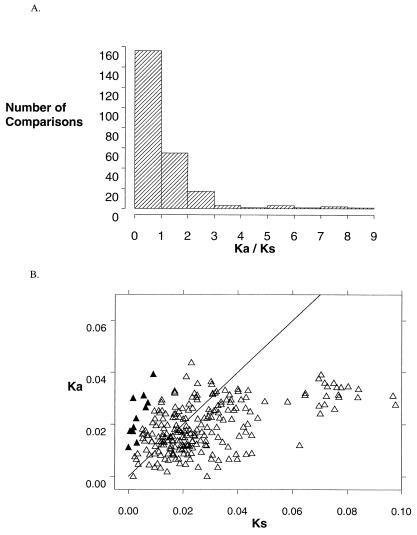
Figure 3.
(A) Distribution of 231 Ka/Ks ratios into intervals, where Ka and Ks are the number of nucleotide substitutions that cause amino acid replacements or are silent, respectively, divided by the number of possible substitutions of each type. Ka/Ks > 1 indicates comparisons where amino acid substitutions are more frequent than predicted by neutral substitution rates. (B) Ka vs. Ks. Ratios > 1 occur above the line Ka = Ks. ▴ denote significant comparisons.

