
Fig. 2.
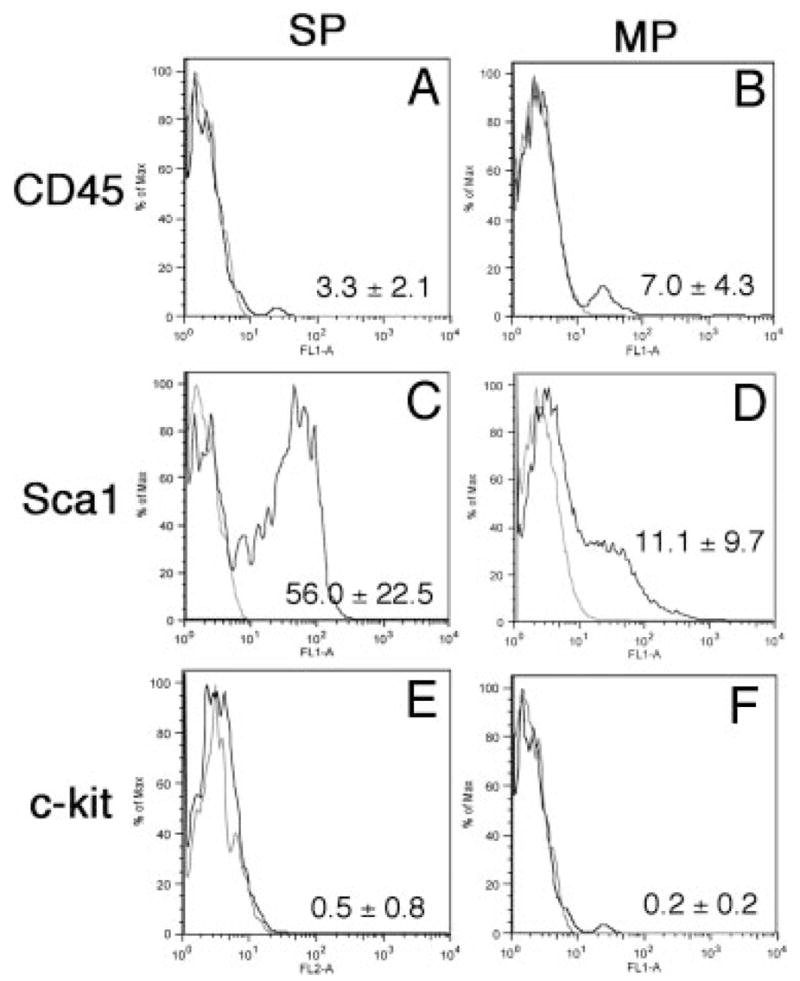
Expression of stem cell markers in thyroid SP and MP populations. Representative FACS results from three to eight independent experiments are shown for CD45 (A and B), Sca1 (C and D), and c-kit (E and F), and the mean number of percentage of (%) positive cells ± SD from these experiments are displayed at the lower right corner. MP cells are basically negative for all three markers, whereas approximately half the SP cells are positive for Sca1.