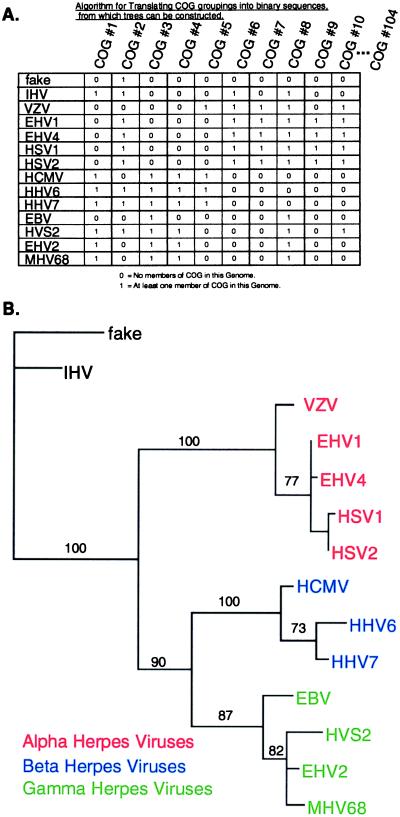
Figure 4.
Whole-genome phylogenetic tree based on gene content. (A) Illustrated is a portion of the COG data matrix for COGs 1–10 with CSN = 3. Rows represent the sequences used for deducing whole-genome gene content trees. The rows are arranged to facilitate visual comparison with the tree shown in B. Columns are the sequences used for deriving the reciprocal gene history tree. (B) Whole-genome neighbor-joining tree based on gene content data from COGs at CSN = 3. A topologically similar tree was constructed by the method of maximum parsimony. Bootstrap numbers are displayed for all nodes in common with the parsimony tree. See Table 1 for definitions of virus abbreviations.

