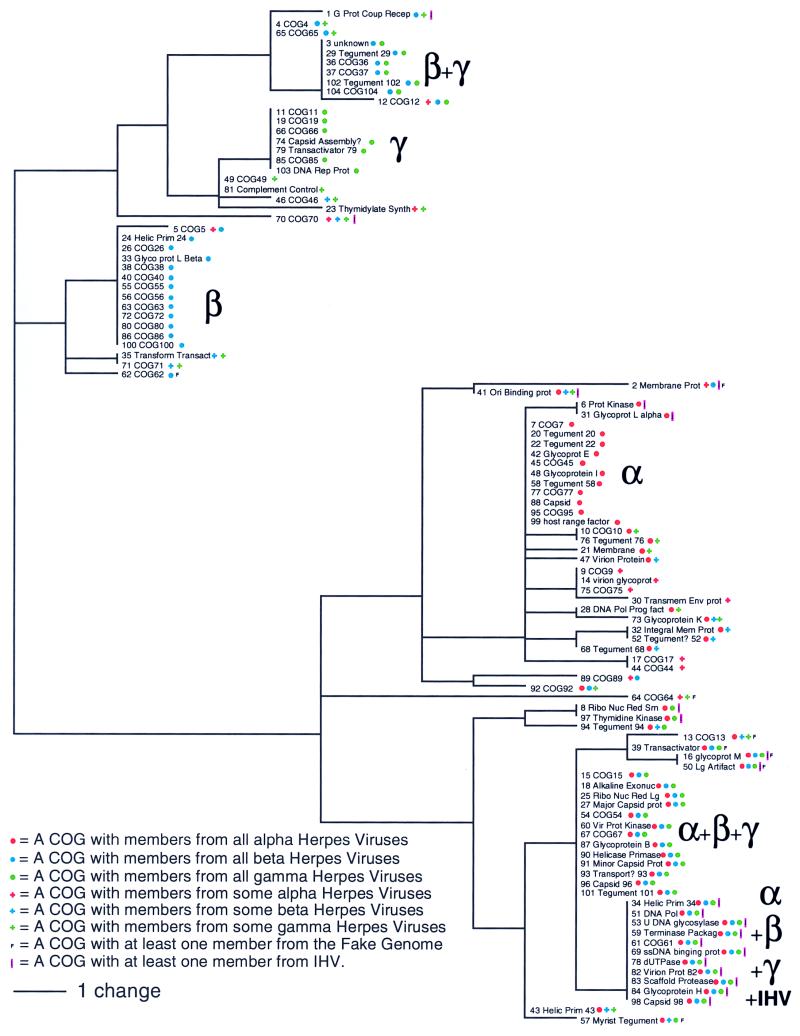
Figure 5.
Reciprocal tree shows a clustering of the phylogenetic profiles of the 104 herpesvirus COGs at CSN = 3. Only the core members of each COG were used in this analysis. The number at the left of each COG description is a tracking number for the COG. Functional descriptions for the COGs were produced by visually inspecting the list of genes in each COG and their GenBank annotation. A listing of COG members can be seen in supplemental data posted on the PNAS web site at www.pnas.org.

