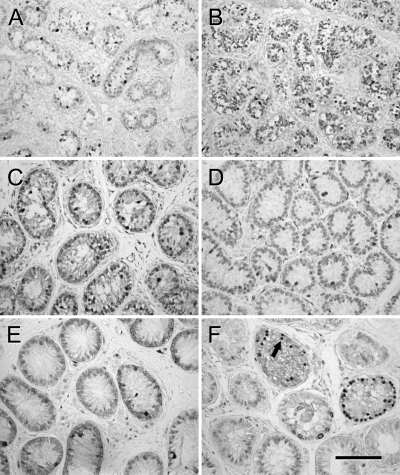
Figure 2.
Expression of PCNA in donor and grafted tissue. A, Three-month-old donor tissue. B, Six-month-old donor tissue. C, Graft from 3-month-old donor recovered from untreated mouse. D, Graft from 6-month-old donor recovered from untreated mouse. E, Graft from 3-month-old donor recovered from gonadotropin-treated mouse. F, Graft from 6-month-old donor recovered from gonadotropin-treated mouse. Strong expression of PCNA was apparent in germ cells (arrow) in F. Bar, 50 μm.

