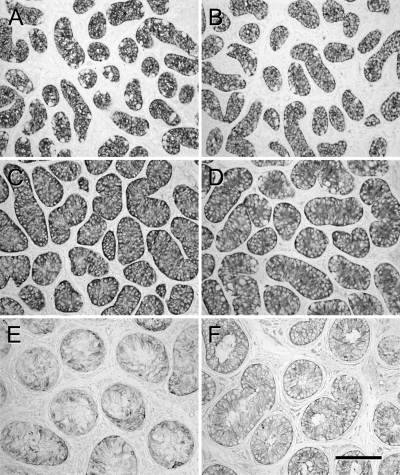
Figure 3.
Expression of MIS in donor and grafted tissue. A, Three-month-old donor tissue. B, Six-month-old donor tissue C, Graft from 3-month-old donor recovered from untreated mouse. D, Graft from 6-month-old donor recovered from untreated mouse. E, Graft from 3-month-old donor recovered from gonadotropin-treated mouse. F, Graft from 6-month-old donor recovered from gonadotropin-treated mouse. Expression is stronger in donor tissue and grafts recovered from untreated mice (A–D), compared with expression in grafts recovered from treated mice (E and F). Bar, 50 μm.

