Figure 4.
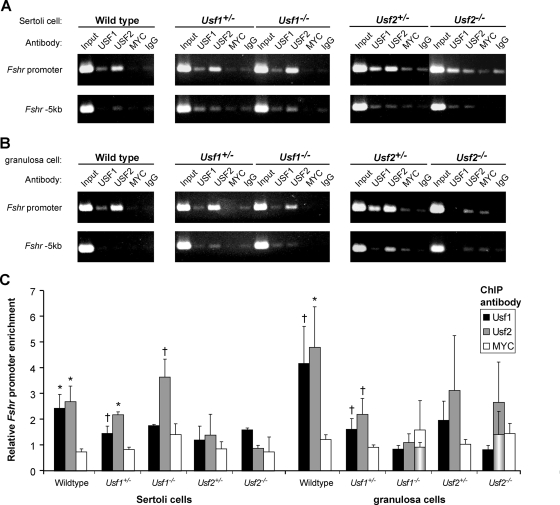
USF dimer binding to the endogenous Fshr promoter differs between ovaries and testes of Usf-null mice. Binding to the endogenous Fshr promoter was evaluated using ChIP in cross-linked chromatin from Sertoli cells (A) or granulosa cells (B) isolated from wild-type, Usf1+/−, Usf1−/−, Usf2+/−, and Usf2−/− mice. The promoter region and a negative control region located 5-kb upstream of the first transcriptional start site were amplified by PCR from each sample of DNA from immunoprecipitated chromatin or input. Immunoprecipitations for USF1 or USF2 were compared with immunoprecipitations with a control antibody against MYC, which does not bind the Fshr E-box, in vitro, and with normal rabbit IgG. Source cell type and genotype for chromatin samples and antibodies used for immunoprecipitation are noted above each ethidium bromide-stained agarose gel. C, Amplified DNA signals of ethidium bromide-stained agarose gels were quantified by densitometric analysis, and normalized data from multiple experiments combined and graphed. The signal for each specific antibody relative to that of control antibody (IgG) was determined for both the promoter and −5-kb regions and the normalized data, representing the ratio of the promoter to −5-kb values, were graphed as the relative promoter to −5-kb signals for each specific antibody relative to that of IgG. Bars represent mean values for USF1 (black), USF2 (gray), and MYC (white), and error bars are sems. The quantified data represent results of at least two independent PCRs for each immunoprecipitation. Granulosa cell data represented by two bars (USF2 immunoprecipitations in Usf2−/− mice and MYC immunoprecipitations in Usf1−/− mice) show data derived from all evaluated samples (rear bar) as well as that derived only from samples considered experimentally valid (front cylindrical bars). A single data point was omitted from the USF2/Usf2−/− immunoprecipitations because its relative signal (3 fold above background) contradicted the absence of this protein in the sample, indicating it was invalid. Two data points from the MYC/Usf1−/− immunoprecipitations were omitted, due to their significant deviation from the mean of all MYC samples (>2 sd values). Values for USF immunoprecipitations that were significantly higher than the corresponding MYC immunoprecipitation from the same chromatin are noted by asterisks (P ≤ 0.05) or crosses (P ≤ 0.2) located immediately above the bars. Statistical significance was determined by a Student’s t test.

