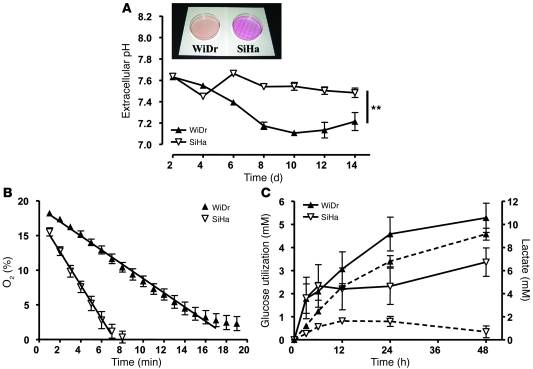
Figure 1. Metabolic characterization of oxidative SiHa and glycolytic WiDr tumor cell lines.
(A) pH of cell culture supernatants after reaching cell confluence on day 0 was measured with a pH meter. Inset shows typical dishes containing confluent WiDr and SiHa cells in phenol red–containing medium. **P = 0.0013 (2-way ANOVA; n = 3). (B) An equal amount (2 × 10⁷ cells/ml) of viable SiHa and WiDr cells were placed in a sealed tube containing an EPR oxygen sensor. EPR measurements revealed a significant difference (P < 0.0001) in the rate of oxygen consumption between SiHa and WiDr tumor cells (Student’s t test; n = 5–9). (C) At time 0, confluent cells received fresh medium containing glucose and FBS. Glucose utilization (solid lines, left y axis) and lactate concentration in the cell supernatant (dotted lines, right y axis) were determined enzymatically. Note the different scales of the left and right y axes. n = 4. Error bars represent the SEM and are sometimes smaller than symbols.

