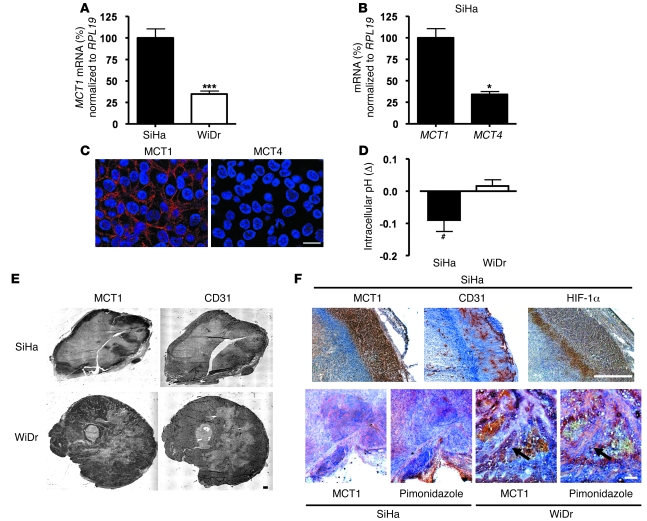
Figure 3. Oxidative tumor cells prominently express MCT1.
(A) qRT-PCR analysis showing higher MCT1 mRNA expression in oxidative SiHa tumor cells compared with glycolytic WiDr tumor cells. ***P = 0.0002 (Student’s t test; n = 8–13). (B) qRT-PCR analysis also showed that oxidative SiHa cells expressed higher levels of MCT1 compared with MCT4 mRNA. *P = 0.0116 (Student’s t test; n = 3–13). (C) MCT1, but not MCT4, is expressed at the plasma membrane of oxidative SiHa tumor cells. Representative confocal pictures show fluorescent staining of MCT1 (red), MCT4 (red), and nuclei (blue) in cultured cells. (D) SiHa and WiDr cells were loaded with the intracellular pH sensor C.SNARF1-AM. Intracellular pH was determined from fluorescence emission before and after addition of sodium lactate to the cell culture medium maintained at pH 7.3. Columns represent the difference (Δ) between the intracellular pH measured in the presence of exogenous lactate and the intracellular pH measured in the absence of exogenous lactate. #P = 0.0393 (Student’s t test; n = 4). (E and F) Immunohistological analyses of tumor biopsies revealed that MCT1 is expressed in both SiHa and WiDr tumors in vivo and that MCT1 expression and hypoxia are mutually exclusive. (E) Representative pictures of whole SiHa and WiDr tumor sections. (F) Representative pictures are shown with H&E counterstaining. Arrows indicate typical mutually exclusive MCT1 and pimonidazole stainings in WiDr tumors. Scale bars: 20 μm (C), 0.5 mm (E and F). Error bars represent SEM.

