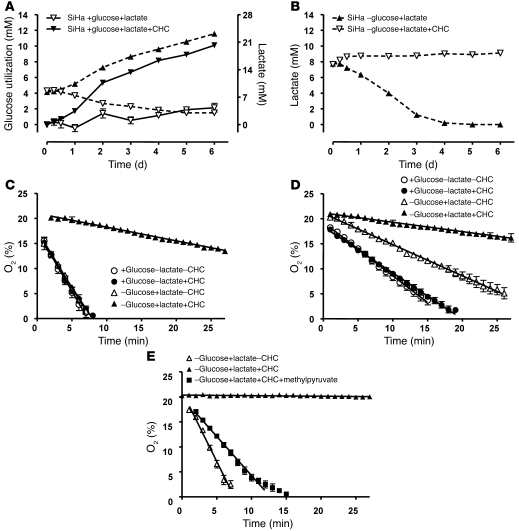
Figure 4. MCT1 inhibition blocks lactate-fueled tumor cell respiration.
(A and B) Enzymatic assays were used to determine glucose utilization (solid lines) and lactate concentration (dotted lines) in the supernatant of confluent cells. Note the different scales of the y axes in A. At time 0, cells received fresh medium containing glucose, FBS, and sodium lactate (A) or medium containing sodium lactate but no glucose and FBS (B). The MCT1 inhibitor CHC was added where indicated. n = 4–5. (C–E) EPR measurements of tumor cell oxygen consumption by SiHa (C and E) and WiDr cells (D) in the indicated experimental culture media. Statistical analyses of C and D are presented in Table 1. Error bars represent the SEM and are sometimes smaller than symbols.

