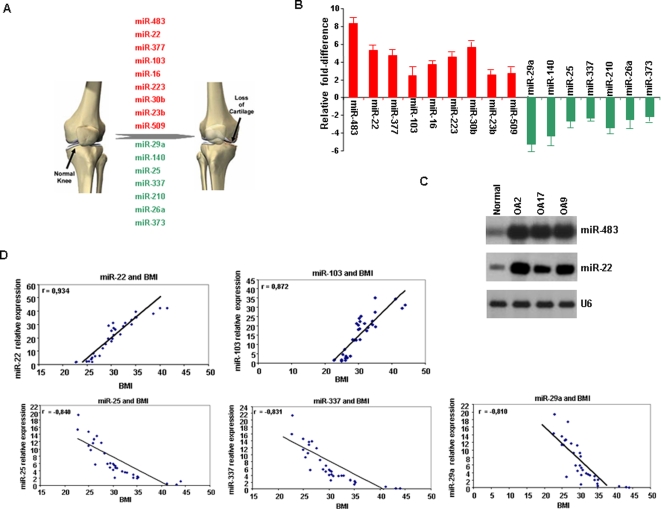
Figure 1. MicroRNA gene signature in osteoarthritis and correlation with clinicopathological parameters.
(A) Up-regulated (red color) and down-regulated (green color) microRNAs in 33 osteoarthritic and 10 normal cartilage samples assayed by TaqMan microRNAs assays. Included microRNAs were more than 2-fold deregulated. (B) Validation of previous results using Real-time SYBR Green microRNA detection assay. (C) Northern blot validation of microRNA microarray data. Representative examples of miR-483 and miR-22 expression in normal and osteoarthritic cartilage tissues (OA2, OA17, OA9). (D) MicroRNAs correlated with BMI (Body Mass Index) analyzed by SSPS version 12.0 statistical program.

