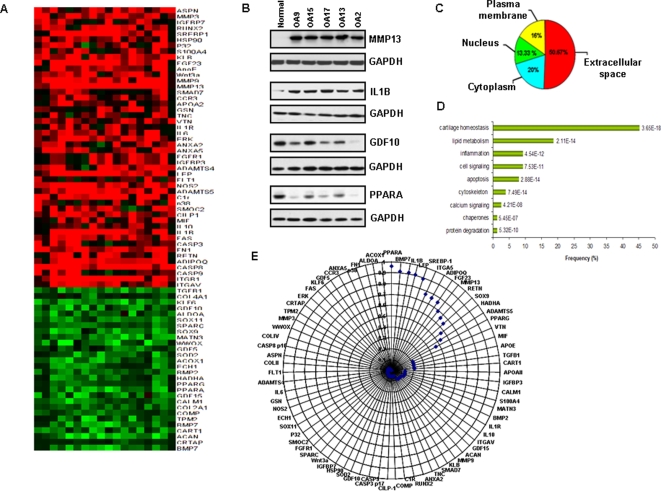
Figure 2. Reverse phase protein arrays in osteoarthritic and normal cartilage tissues.
(A) Differentially expressed proteins between osteoarthritic and normal chondrocytes. Up-regulated are shown with red color, while down-regulated with green color. (B) Representative western blot analysis in protein extracts from five osteoarthritic tissues in comparison with normal cartilage. (C) Sub-cellular localization of differentially expressed proteins. (D) Functional clustering analysis of differentially expressed proteins (using DAVID NIH Bioinformatic Database). (E) Correlation coefficient wheel between protein expression levels of differentially expressed proteins in osteoarthritic vs normal chondrocytes and body mass index (BMI). We identified 3 protein groups, which showed statistically significant correlations between protein expression and BMI, according to the coefficient correlation index (r2). More specifically, the first group with the highest correlation (r2>0.900) consisted of PPARA, BMP7, IL1B, LEP (leptin) and SREBP1 proteins. The second group (0.600>r2>0.900) consisted of ITGA5, ADIPOQ (adiponectin), FGF23, MMP13, RETN (resistin) and SOX9. The third group (0.400>r2>0.600) consisted of 3 proteins (HADHA, ADAMTS5, PPARG) which had low degree of correlation with BMI. The rest of the proteins were not correlated with BMI.

