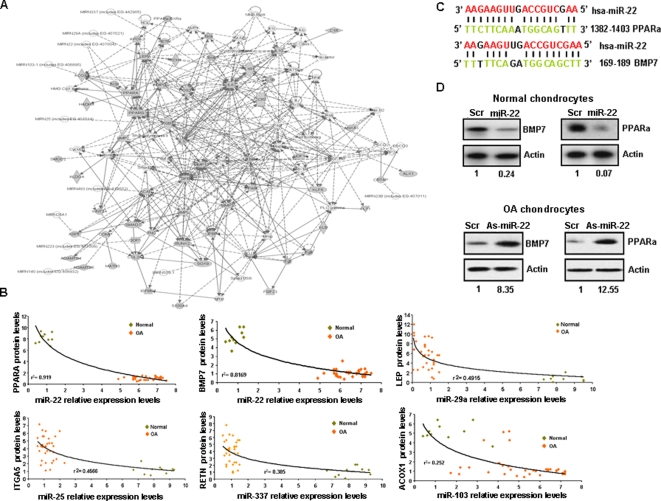
Figure 3. Interactome network in osteoarthritis.
(A) Construction of an interactome network (p = 10-49) by integrating microRNA and proteomic data using Ingenuity Pathway Analysis (IPA) (more information in suppl. methods). The p value indicates the likelihood of focus genes to belong to a network versus those obtained by chance. Around half of the microRNAs (mir-337, miR-29a, miR-22, miR-103-1, miR-25) regulate genes involved in the metabolic pathways. (B) Correlation coefficients between microRNA expression levels and their gene targets protein levels in osteoarthritic and normal chondrocytes. (C) Predicted duplex formation between PPARA and BMP7 3′UTR with miR-22. (D) BMP7 and PPARA protein levels after miR-22 or inhibitor of miR-22 (as-miR-22) treatment (50 nM) for 48 h in normal and osteoarthritic chondrocytes, respectively.

