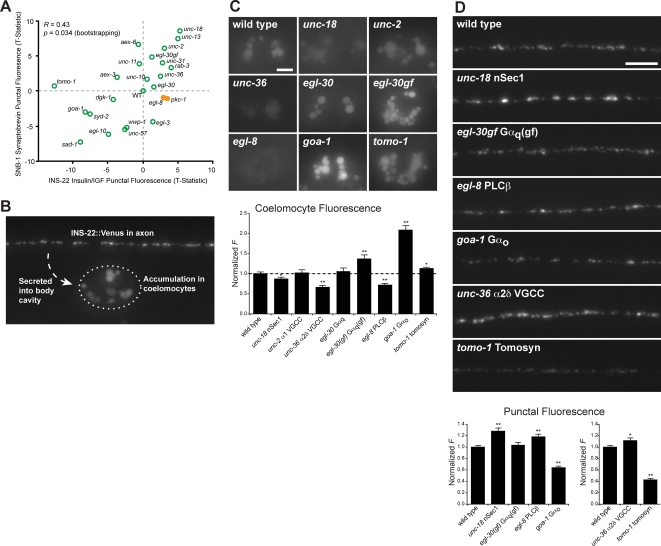
Figure 6. Analysis of DCV accumulation in axons and insulin/IGF secretion.
(A) XY plot comparing changes in the punctal fluorescence of SNB-1 synaptobrevin and INS-22 insulin/IGF. Two mutants with more prominent increases in INS-22 insulin/IGF than SNB-1 synaptobrevin are shown as solid orange circles. (B) Secreted INS-22 insulin/IGF expressed in motorneurons accumulates in coelomocytes. (C) Images of INS-22 insulin/IGF accumulation in coelomocytes in wild type and mutant animals. Scale bar, 5 µm. Below is shown the quantification of coelomocyte INS-22 insulin/IGF fluorescence. (D) Images of axonal INS-22 insulin/IGF in wild type animals and mutants with altered INS-22 insulin/IGF coelomocyte fluorescence. Scale bar, 5 µm. Below is shown the quantification of INS-22 insulin/IGF punctal fluorescence. In (C–D), * indicates p<0.05, ** indicates p<0.01, (Student's T-Test compared to wild type). All error bars are ±SEM. Separate charts indicate data from separate sets of experiments.

