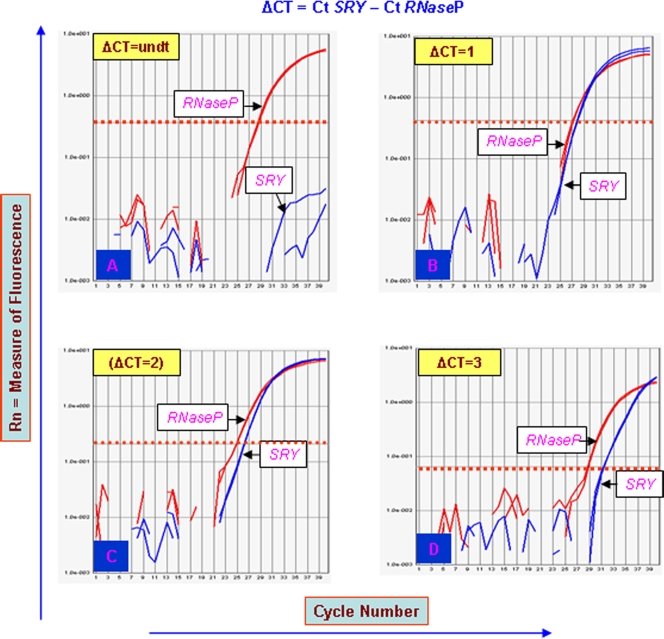
Figure 5. Real Time PCR plots for SRY in Turner patients.
(A) Due to very low number or absence of cells harboring Y chromosome in Turners' AT2 to AT12, the Ct for SRY remained undetermined and thus copy number of the same could not be calculated. (B) Real Time PCR plot of a normal male with ΔCt = 1 corresponding to copies of the SRY = 1. (C) and (D) represent plots for additional mosaicisms in the context of percentage of the Y chromosome (and thus for the SRY gene) in Turner AT13. The ΔCt values (2 or 4) are unexpected, suggesting that percentage of cells harboring SRY is less compared to the ones harboring RNaseP gene. In Turners AT1 and AT15, ΔCt −3 and −2 respectively, were observed resulting in 16 and 8 copies of the SRY gene (not shown).

