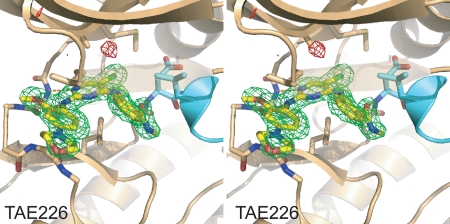
Figure 2. Difference electron density map for the FAK/TAE226 structure.
Fo-Fc electron density calculated from experimental data and the final model with TAE226 removed is shown in stereo contoured at 3.5 σ. Positive electron density is colored green and negative density is colored red. FAK is shown as beige ribbon with its activation loop in cyan. TAE226 (yellow) and sidechains involved in inhibitor binding are shown in stick representation. The ribbons of residues 429–431 in the P-loop are rendered transparent for clarity. Difference electron density for TAE226 is well defined.

