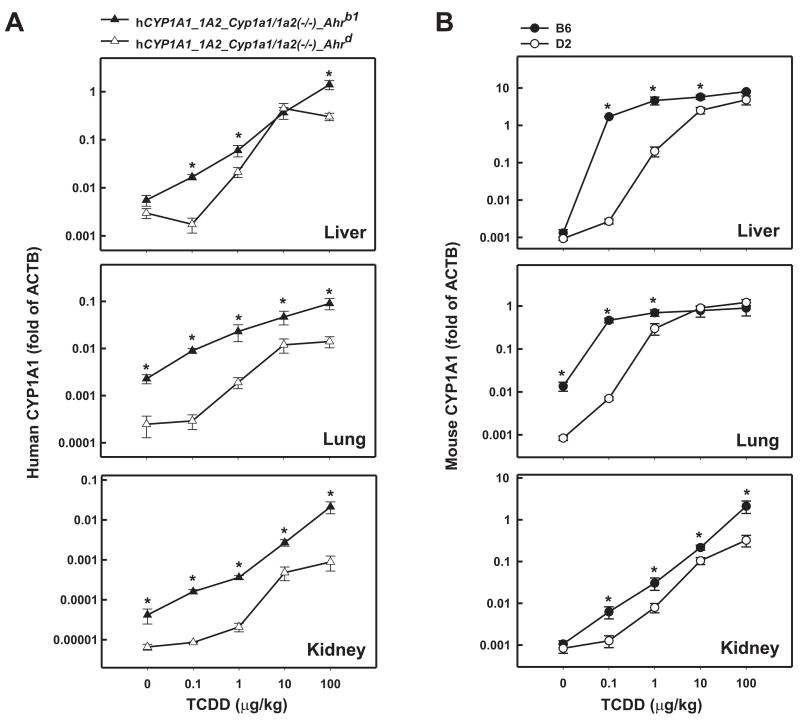
FIG. 2.
Log-log dose-response plots of CYP1A1 mRNA as a function of administered TCDD in liver, lung and kidney. Mice received either vehicle only or one of four doses of intraperitoneal TCDD 48 h before killing. Human (A) and mouse (B) CYP1A1 mRNA levels were compared by normalizing their concentrations to that of β-actin (ACTB) mRNA; PCR reactions for CYP1A1 mRNA and ACTB mRNA were performed on the same plate. Based on the plate reader, the efficiency for each single well was >90%. Note the striking differences in values on the ordinates. Data are reported as means ± S.E.M. (N=3–4 mice per group). *P <0.05, when comparing mRNA levels for that gene, at the same dose of TCDD, between the two mouse lines (A) or between the two inbred strains (B).

