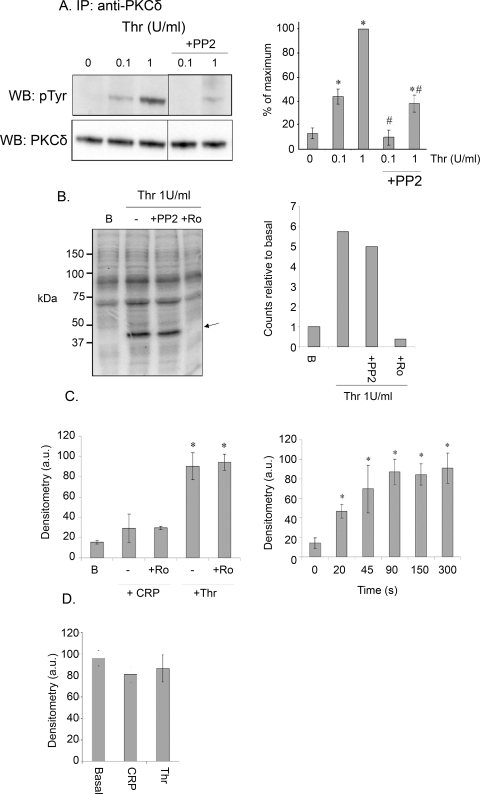
Figure 3. (A) Effect of PP2 on PKCδ tyrosine phosphorylation.
Human washed platelets were treated with 0.1 or 1 U/ml thrombin for 1 min in the presence or absence of PP2 (10 µM, 5 min). Immunoprecipitations and reprobes were carried out as described in the methods. Histogram shows mean density of bands, normalised according to the basal value. (B) Effect of PP2 on pleckstrin phosphorylation in thrombin-stimulated platelets. Washed human platelets were labelled with radioactive 32P-orthophosphate and stimulated with 1 U/ml thrombin for 1 min. PP2 (10 µM, 5 min) or Ro31-8220 (10 µM, 1 min) were added where indicated. After separation by SDS-PAGE, the resulting gel was analysed using a phosphoimager to obtain radioactivity levels. Histogram shows the level of pleckstrin phosphorylation compared to basal levels. Data from one experiment, representative of two. (C) Tyrosine phosphorylation of PKCδ in mouse platelets. Washed mouse platelets were stimulated with 3 µg/ml CRP or 1 U/ml thrombin in the absence or presence of Ro31-8220 (10 µM, 1 min) (left), or with 1 U/ml thrombin for the times shown (right) in the presence of apyrase (2.5 U/ml) and indomethacin (10 µM). Immunoprecipitations and reprobes were carried out as described in the methods. Histogram shows mean density of bands, normalised according to the basal value. (D) Tyrosine phosphorylation of PKCε in mouse platelets. Washed mouse platelets were stimulated with 3 µg/ml CRP or 1 U/ml thrombin for 1 min. Immunoprecipitations and reprobes were carried out as described in the methods. All studies described in this figure were performed in the presence of apyrase (2.5 U/ml) and indomethacin (10 µM). Histograms show mean density of bands, normalised according to the basal value: *signifies values significant from basal, #signifies significant from equivalent time point without inhibitor. Data is from 3 separate experiments.

