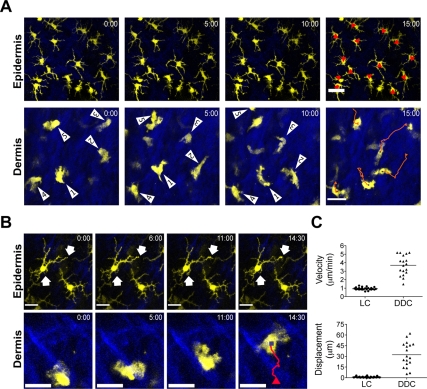
Figure 3. Migratory behavior of LC and DDC.
(A) Representative time-lapse images from 2P-IVM showing the migratory behavior of LC and DDC. Red line, track of migration during the observation period. Scale bar, 25 µm. (B) Representative high magnification time-lapse images showing the cellular movement of LC and DDC. Scale bars, 16 µm (epidermis) and 25 µm (dermis). Arrows illustrate dendrite movements. Red line, track of migration during the observation period. (C) Upper panel, mean velocity of LC and DDC; lower panel, displacement of LC and DDC from 15 min tracks. Symbols represent individual cells.

