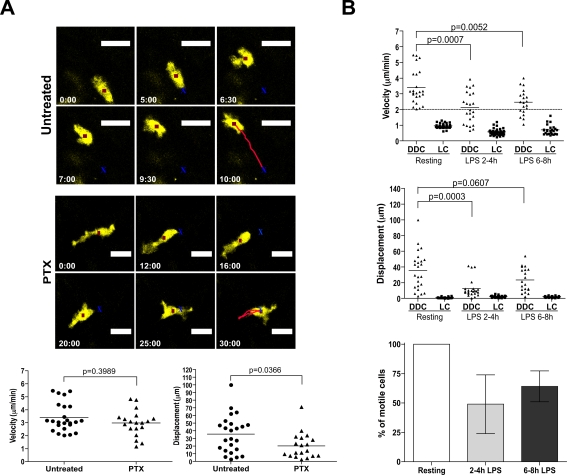
Figure 4. Migratory mechanisms of DDC and LC.
(A) Response of DDC to systemic injection of PTX. Top and middle panels depict a representative cell under control and PTX treatment conditions, respectively. The red square indicates the cell centroid, and the red line shows movement of the centroid over the observation period (n = 3 experiments for PTX treatment). Lower panel, data points represent individual cells, lines indicate mean. (B) Upper and middle plots show mean velocity and displacement of LC and DDC in response to systemic LPS challenge over time (n = 3 experiments). Data points represent individual cells, lines indicate mean. Lower plot shows the frequency of motile DDC at resting state, 2 to 4 h and 6 to 8 h after LPS treatment from 30 min tracks (bars represent mean±SEM).

