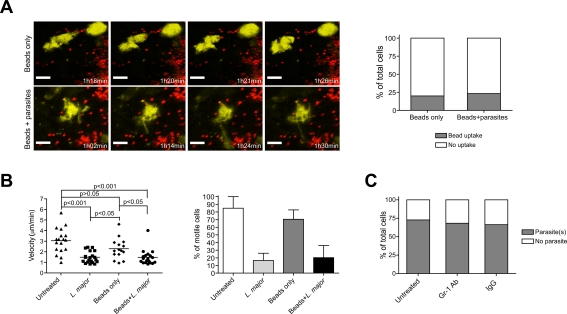
Figure 7. Discrimination of inert beads and L. major uptake by DDC and role of neutrophils in parasite uptake.
(A) Left panels, time-lapse images from 2P-IVM showing the cellular behaviors of DDC (yellow) after fluorescent bead inoculation alone (red) or beads (red) together with L. major promastigotes (unlabelled). Right panel, frequency of DDC with intracellular beads in the presence or absence of L. major parasites (>50 cells obtained from randomly selected fields). Scale bar, 12 µm. n = 3 experiments. (B) Mean velocity and frequency of motile DDC (mean±SEM ) at resting state, after LmjF-DsRed2 promastigote, beads only, and beads plus L. major promastigote inoculation. Data points represent individual cells. (C) Frequency of DDC with internalized LmjF-DsRed2 parasites in the ear skin of control (IgG), or neutrophil depleted (Gr-1 Ab) CD11c-YFP mice. n = 3 experiments.

