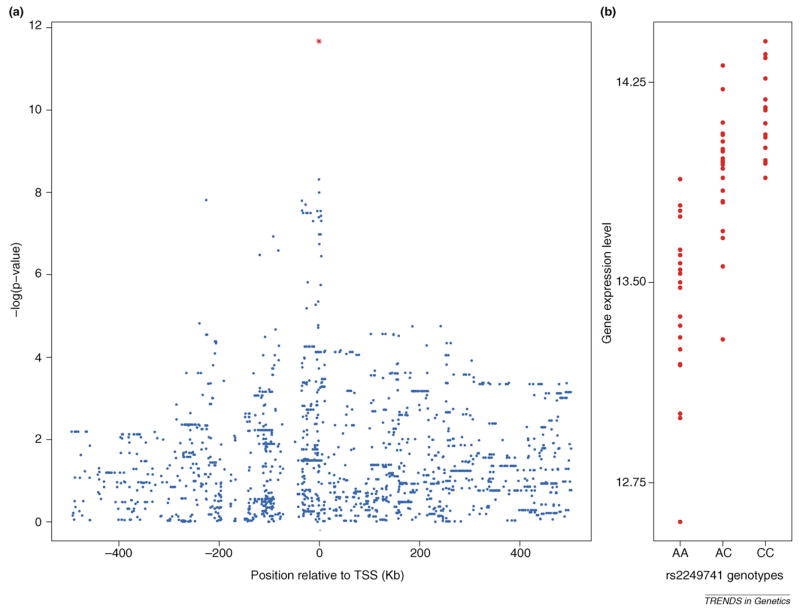
Figure 1.
Example of an expression quantitative trait loci (eQTL) for the HLA-C gene in the HapMap European samples (data from Ref. [55]). (a) Plot of •log(P values) for the association between individual single nucleotide polymorphisms (SNPs) and expression of HLA-C. The location of the gene is indicated by the small red bar at the bottom of the figure, and the x-axis measures location relative to the transcription start site (TSS). Each data point is for a single SNP. (b) Individual expression levels of HLA-C, grouped according to the genotype of the most significant SNP in the region (rs2249741; indicated by the red data point in panel (a). Interestingly, one of the SNPs in the signal peak in panel (a) (rs92644942) has also been associated with HIV set point, suggesting that higher expression of HLA-C can help reduce HIV viral load [62].

