
Fig. 4.
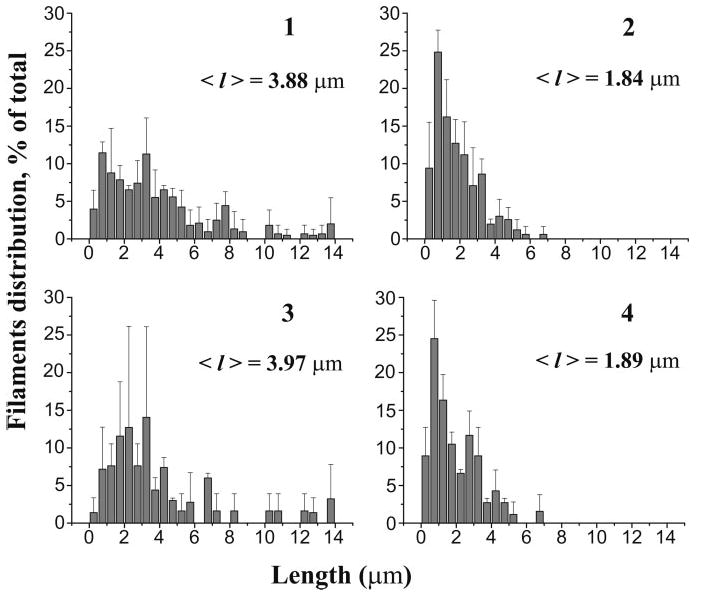
Distribution of actin filaments length upon severing by cofilin at pH 6.0 and 8.0. Snapshot images of TRC-F-actin filaments attached to HMM were enhanced and processed using Sigma Scan Pro 5 image analysis program. The length of at least 200 filaments was measured in each case after the screen was calibrated using a grid-containing slide. Length distributions at pH 6.0 (1, 2) and pH 8.0 (3, 4) are shown for filaments before the addition of 20 nM cofilin (1, 3) and after 2 minutes of incubation at 25°C (2, 4). The data obtained at pH 6.8 are given in Table 1.